Introduction
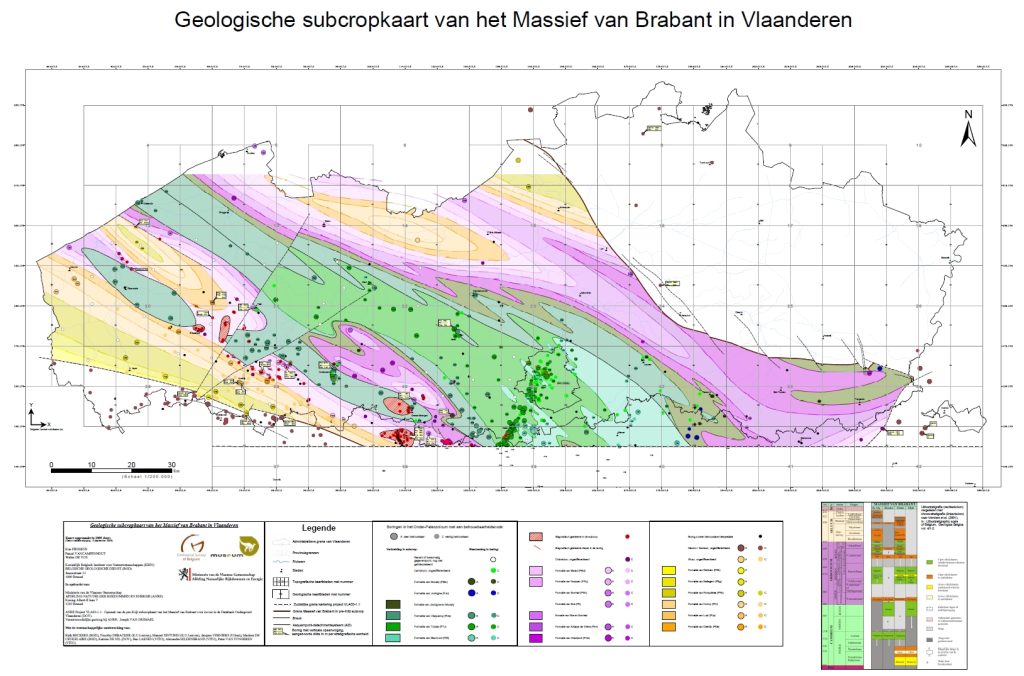
The map discussed here shows the subcrop rocks of the Lower Paleozoic, with the exception of two small areas near Halle and Mark, where these rocks reach the surface. The hard rocks on this map are covered with sediments from the Quaternary, Tertiary, Cretaceous, and/or Devonian. Generally, we can state that this map represents the deep hard core of the Brabant Massif, which is composed of rocks from the Cambrian, Ordovician, and/or Silurian.
Up until now, the commonly used geological subcrop maps were those by Legrand (1968) and De Vos et al. (1993). Other authors, such as Mansy et al. (1999) and Sintubin and Everaerts (2002), also published structural maps of the massif. All these maps indicate that there are various views on the architecture and deformation history of the Brabant Massif. The lack of consensus, combined with the variety and quantity of data published since 1993, were the main drivers behind the remapping of the Brabant Massif on Flemish territory.
Principles
Objectives
At the start of the project, all then-current concepts regarding the Brabant Massif were evaluated. One of the main goals was to arrive at a conceptual geological map based on raw data and only well-argued structures. The intention is that this map indicates which rocks are located at a certain depth beneath the cover layers, with as few large-scale structural concepts as possible.
Mapping Method
The mapping proceeded in five clearly defined steps, each supported by the steering committee:
In the first phase, all existing data were verified. All existing drilling descriptions were inventoried and checked against existing cores from the BGS archive collection. All lithological descriptions were reinterpreted according to the most recent lithostratigraphic scale (Verniers et al., 2001). Approximately 800 observation points were identified, of which around 500 could be interpreted down to the formation level;
In the second phase, this data was geographically visualized on a map. This map shows all available data and the data density, without any interpretation;
In the next step, the distribution map was drawn, based on the data visualization map. This map shows a possible interpolation between the points. This interpretation was limited to maintaining a WNW-ESE trend. Formation contacts were not interpreted, although some anomalous contacts – i.e., the absence of intermediate formations – can be identified on this map;
In the fourth phase, existing hypotheses, mainly the existing structural maps by various authors, were tested against this initial interpretation by superimposing these maps onto the subcrop map. This, along with a critical evaluation, showed that most of the common structures in the literature are poorly supported by geological evidence;
The fifth and final step consisted of drawing the conceptual map, based on core data. Secondary sources of information, such as aeromagnetism and gravimetry, were integrated as a complement to the map. This is preferably done by using the conceptual map to explain the aeromagnetic lineaments, and only then deriving geological structures from them. Upon completing the map, the implications and possibilities of the hypotheses supporting the initial conceptual map were evaluated. If a specific concept was rejected, step five of the mapping process was repeated.
All these steps result in a new geological subcrop map of the Brabant Massif, based on an objective evaluation of all available data and interpretations.
The subcrop Map (note that it has been done in Dutch)
Prices
The maps are avalaible on:
– digital form, and can be downloaded freely in PDF hereafter with the following files
-> the map made in 2005 in PDF (dowload – 10.6 Mo)
-> the updated map in 2006 in PDF (dowload – 20.6 Mo)
-> the document overlay 1 in PDF (dowload – 195 Ko)
-> the document overlay 2 1 in PDF (dowload – 163 Ko)
-> the document overlay 3 1 in PDF (dowload – 305 Ko)
– the vectorial files were also created in a GIS system and are available on request or can be integrated from the dov.vlaanderen.be platform into your GIS environment as a WMS file.
References
This map has the following reference and many other bibliographic references are available in the report associated to the map (and can be requested as well).
Kris Piessens, Walter De Vos, Ruth Beckers, Pascal Vancampenhout en Marleen De Ceukelaire (2005). Opmaak van de pre-Krijt subcropkaart van het Massief van Brabant voor invoering in de Databank Ondergrond Vlaanderen – Eindverslag Project VLA03-1.1. In opdracht van: ministerie van de Vlaamse Gemeenschap – afdeling Natuurlijke Rijkdommen en Energie
To Order:
| This product is available for sale at the GSB. For ordering, please contact – gsb@naturalsciences.be |
